在前一篇文章中提到了如何使用Prometheus+Grafana来监控JVM。本文介绍如何使用Prometheus+Alertmanager来对JVM的某些情况作出告警。
本文所提到的脚本可以在这里下载。
摘要
用到的工具:
先讲一下大致步骤:
- 利用JMX exporter,在Java进程内启动一个小型的Http server
- 配置Prometheus抓取那个Http server提供的metrics。
- 配置Prometheus的告警触发规则
- heap使用超过最大上限的50%、80%、90%
- instance down机时间超过30秒、1分钟、5分钟
- old gc时间在最近5分钟里超过50%、80%
- 配置Grafana连接Prometheus,配置Dashboard。
- 配置Alertmanager的告警通知规则
告警的大致过程如下:
- Prometheus根据告警触发规则查看是否触发告警,如果是,就将告警信息发送给Alertmanager。
- Alertmanager收到告警信息后,决定是否发送通知,如果是,则决定发送给谁。
第一步:启动几个Java应用
-
新建一个目录,名字叫做prom-jvm-demo。
-
下载JMX exporter到这个目录。
-
新建一个文件simple-config.yml内容如下:
1
2
3
4
5
6
7
8
9
|
---
lowercaseOutputLabelNames: true
lowercaseOutputName: true
whitelistObjectNames: ["java.lang:type=OperatingSystem"]
rules:
 - pattern: 'java.lang<type=OperatingSystem><>((?!process_cpu_time)\w+):'
   name: os_$1
   type: GAUGE
   attrNameSnakeCase: true
|
- 运行以下命令启动3个Tomcat,记得把
<path-to-prom-jvm-demo>替换成正确的路径(这里故意把-Xmx和-Xms设置的很小,以触发告警条件):
 1
 2
 3
 4
 5
 6
 7
 8
 9
10
11
12
13
14
15
16
17
18
19
20
21
22
23
|
docker run -d \
  --name tomcat-1 \
  -v <path-to-prom-jvm-demo>:/jmx-exporter \
  -e CATALINA_OPTS="-Xms32m -Xmx32m -javaagent:/jmx-exporter/jmx_prometheus_javaagent-0.3.1.jar=6060:/jmx-exporter/simple-config.yml" \
  -p 6060:6060 \
  -p 8080:8080 \
  tomcat:8.5-alpine

docker run -d \
  --name tomcat-2 \
  -v <path-to-prom-jvm-demo>:/jmx-exporter \
  -e CATALINA_OPTS="-Xms32m -Xmx32m -javaagent:/jmx-exporter/jmx_prometheus_javaagent-0.3.1.jar=6060:/jmx-exporter/simple-config.yml" \
  -p 6061:6060 \
  -p 8081:8080 \
  tomcat:8.5-alpine

docker run -d \
  --name tomcat-3 \
  -v <path-to-prom-jvm-demo>:/jmx-exporter \
  -e CATALINA_OPTS="-Xms32m -Xmx32m -javaagent:/jmx-exporter/jmx_prometheus_javaagent-0.3.1.jar=6060:/jmx-exporter/simple-config.yml" \
  -p 6062:6060 \
  -p 8082:8080 \
  tomcat:8.5-alpine
|
-
访问http://localhost:8080|8081|8082看看Tomcat是否启动成功。
-
访问对应的http://localhost:6060|6061|6062看看JMX exporter提供的metrics。
备注:这里提供的simple-config.yml仅仅提供了JVM的信息,更复杂的配置请参考JMX exporter文档。
第二步:启动Prometheus
- 在之前新建目录
prom-jvm-demo,新建一个文件prom-jmx.yml,内容如下:
 1
 2
 3
 4
 5
 6
 7
 8
 9
10
11
12
13
14
15
16
17
18
19
|
scrape_configs:
  - job_name: 'java'
    scrape_interval: 30s
    static_configs:
    - targets:
      - '<host-ip>:6060'
      - '<host-ip>:6061'
      - '<host-ip>:6062'

# alertmanager的地址
alerting:
  alertmanagers:
  - static_configs:
    - targets:
      - '<host-ip>:9093'

# 读取告警触发条件规则
rule_files:
  - '/prometheus-config/prom-alert-rules.yml'
|
- 新建文件
prom-alert-rules.yml,该文件是告警触发规则:
 1
 2
 3
 4
 5
 6
 7
 8
 9
10
11
12
13
14
15
16
17
18
19
20
21
22
23
24
25
26
27
28
29
30
31
32
33
34
35
36
37
38
39
40
41
42
43
44
45
46
47
48
49
50
51
52
53
54
55
56
57
58
59
60
61
62
63
64
65
66
67
68
69
70
71
72
73
74
75
76
77
78
79
80
81
82
83
84
85
86
87
88
89
90
91
92
93
94
|
# severity按严重程度由高到低:red、orange、yello、blue
groups:
  - name: jvm-alerting
    rules:

    # down了超过30秒
    - alert: instance-down
      expr: up == 0
      for: 30s
      labels:
        severity: yellow
      annotations:
        summary: "Instance {{ $labels.instance }} down"
        description: "{{ $labels.instance }} of job {{ $labels.job }} has been down for more than 30 seconds."

    # down了超过1分钟
    - alert: instance-down
      expr: up == 0
      for: 1m
      labels:
        severity: orange
      annotations:
        summary: "Instance {{ $labels.instance }} down"
        description: "{{ $labels.instance }} of job {{ $labels.job }} has been down for more than 1 minutes."

    # down了超过5分钟
    - alert: instance-down
      expr: up == 0
      for: 5m
      labels:
        severity: red
      annotations:
        summary: "Instance {{ $labels.instance }} down"
        description: "{{ $labels.instance }} of job {{ $labels.job }} has been down for more than 5 minutes."

    # 堆空间使用超过50%
    - alert: heap-usage-too-much
      expr: jvm_memory_bytes_used{job="java", area="heap"} / jvm_memory_bytes_max * 100 > 50
      for: 1m
      labels:
        severity: yellow
      annotations:
        summary: "JVM Instance {{ $labels.instance }} memory usage > 50%"
        description: "{{ $labels.instance }} of job {{ $labels.job }} has been in status [heap usage > 50%] for more than 1 minutes. current usage ({{ $value }}%)"

    # 堆空间使用超过80%
    - alert: heap-usage-too-much
      expr: jvm_memory_bytes_used{job="java", area="heap"} / jvm_memory_bytes_max * 100 > 80
      for: 1m
      labels:
        severity: orange
      annotations:
        summary: "JVM Instance {{ $labels.instance }} memory usage > 80%"
        description: "{{ $labels.instance }} of job {{ $labels.job }} has been in status [heap usage > 80%] for more than 1 minutes. current usage ({{ $value }}%)"

    # 堆空间使用超过90%
    - alert: heap-usage-too-much
      expr: jvm_memory_bytes_used{job="java", area="heap"} / jvm_memory_bytes_max * 100 > 90
      for: 1m
      labels:
        severity: red
      annotations:
        summary: "JVM Instance {{ $labels.instance }} memory usage > 90%"
        description: "{{ $labels.instance }} of job {{ $labels.job }} has been in status [heap usage > 90%] for more than 1 minutes. current usage ({{ $value }}%)"

    # 在5分钟里,Old GC花费时间超过30%
    - alert: old-gc-time-too-much
      expr: increase(jvm_gc_collection_seconds_sum{gc="PS MarkSweep"}[5m]) > 5 * 60 * 0.3
      for: 5m
      labels:
        severity: yellow
      annotations:
        summary: "JVM Instance {{ $labels.instance }} Old GC time > 30% running time"
        description: "{{ $labels.instance }} of job {{ $labels.job }} has been in status [Old GC time > 30% running time] for more than 5 minutes. current seconds ({{ $value }}%)"

    # 在5分钟里,Old GC花费时间超过50%
    - alert: old-gc-time-too-much
      expr: increase(jvm_gc_collection_seconds_sum{gc="PS MarkSweep"}[5m]) > 5 * 60 * 0.5
      for: 5m
      labels:
        severity: orange
      annotations:
        summary: "JVM Instance {{ $labels.instance }} Old GC time > 50% running time"
        description: "{{ $labels.instance }} of job {{ $labels.job }} has been in status [Old GC time > 50% running time] for more than 5 minutes. current seconds ({{ $value }}%)"

    # 在5分钟里,Old GC花费时间超过80%
    - alert: old-gc-time-too-much
      expr: increase(jvm_gc_collection_seconds_sum{gc="PS MarkSweep"}[5m]) > 5 * 60 * 0.8
      for: 5m
      labels:
        severity: red
      annotations:
        summary: "JVM Instance {{ $labels.instance }} Old GC time > 80% running time"
        description: "{{ $labels.instance }} of job {{ $labels.job }} has been in status [Old GC time > 80% running time] for more than 5 minutes. current seconds ({{ $value }}%)"
|
- 启动Prometheus:
1
2
3
4
5
|
docker run -d \
  --name=prometheus \
  -p 9090:9090 \
  -v <path-to-prom-jvm-demo>:/prometheus-config \
  prom/prometheus --config.file=/prometheus-config/prom-jmx.yml
|
- 访问http://localhost:9090/alerts应该能看到之前配置的告警规则:
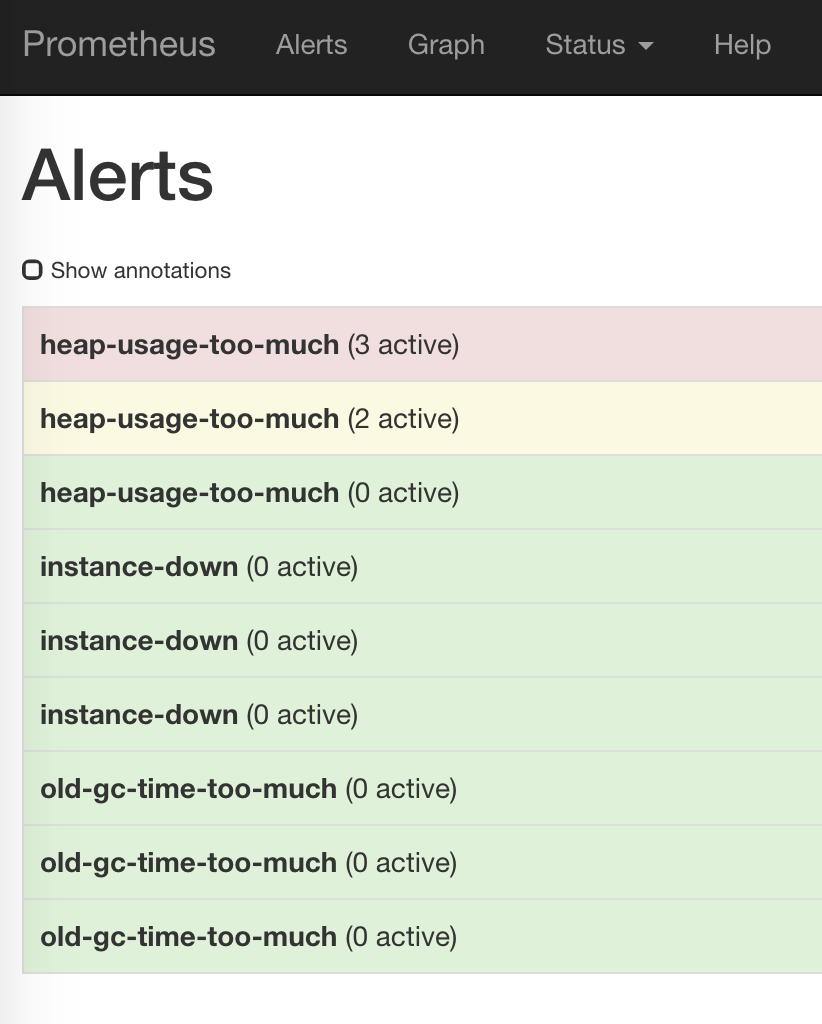
如果没有看到三个instance,那么等一会儿再试。
第三步:配置Grafana
参考使用Prometheus+Grafana监控JVM
第四步:启动Alertmanager
- 新建一个文件
alertmanager-config.yml:
 1
 2
 3
 4
 5
 6
 7
 8
 9
10
11
12
13
14
15
16
17
18
19
20
21
22
23
24
25
26
27
28
29
30
31
32
33
34
35
36
37
38
39
40
41
42
43
44
45
46
47
48
49
50
51
52
53
54
55
56
57
58
59
60
61
62
63
|
global:
  smtp_smarthost: '<smtp.host:ip>'
  smtp_from: '<from>'
  smtp_auth_username: '<username>'
  smtp_auth_password: '<password>'

# The directory from which notification templates are read.
templates:
- '/alertmanager-config/*.tmpl'

# The root route on which each incoming alert enters.
route:
  # The labels by which incoming alerts are grouped together. For example,
  # multiple alerts coming in for cluster=A and alertname=LatencyHigh would
  # be batched into a single group.
  group_by: ['alertname', 'instance']

  # When a new group of alerts is created by an incoming alert, wait at
  # least 'group_wait' to send the initial notification.
  # This way ensures that you get multiple alerts for the same group that start
  # firing shortly after another are batched together on the first
  # notification.
  group_wait: 30s

  # When the first notification was sent, wait 'group_interval' to send a batch
  # of new alerts that started firing for that group.
  group_interval: 5m

  # If an alert has successfully been sent, wait 'repeat_interval' to
  # resend them.
  repeat_interval: 3h

  # A default receiver
  receiver: "user-a"

# Inhibition rules allow to mute a set of alerts given that another alert is
# firing.
# We use this to mute any warning-level notifications if the same alert is
# already critical.
inhibit_rules:
- source_match:
    severity: 'red'
  target_match_re:
    severity: ^(blue|yellow|orange)$
  # Apply inhibition if the alertname and instance is the same.
  equal: ['alertname', 'instance']
- source_match:
    severity: 'orange'
  target_match_re:
    severity: ^(blue|yellow)$
  # Apply inhibition if the alertname and instance is the same.
  equal: ['alertname', 'instance']
- source_match:
    severity: 'yellow'
  target_match_re:
    severity: ^(blue)$
  # Apply inhibition if the alertname and instance is the same.
  equal: ['alertname', 'instance']

receivers:
- name: 'user-a'
  email_configs:
  - to: '<user-a@domain.com>'
|
修改里面关于smtp_*的部分和最下面user-a的邮箱地址。
备注:因为国内邮箱几乎都不支持TLS,而Alertmanager目前又不支持SSL,因此请使用Gmail或其他支持TLS的邮箱来发送告警邮件,见这个issue,这个问题已经修复,下面是阿里云企业邮箱的配置例子:
1
2
3
4
5
6
|
smtp_smarthost: 'smtp.qiye.aliyun.com:465'
smtp_hello: 'company.com'
smtp_from: 'username@company.com'
smtp_auth_username: 'username@company.com'
smtp_auth_password: password
smtp_require_tls: false
|
- 新建文件
alert-template.tmpl,这个是邮件内容模板:
1
2
3
4
5
6
7
8
9
|
{{ define "email.default.html" }}
<h2>Summary</h2>

<p>{{ .CommonAnnotations.summary }}</p>

<h2>Description</h2>

<p>{{ .CommonAnnotations.description }}</p>
{{ end}}
|
3) 运行下列命令启动:
1
2
3
4
5
|
docker run -d \
  --name=alertmanager \
  -v <path-to-prom-jvm-demo>:/alertmanager-config \
  -p 9093:9093 \
  prom/alertmanager:master --config.file=/alertmanager-config/alertmanager-config.yml
|
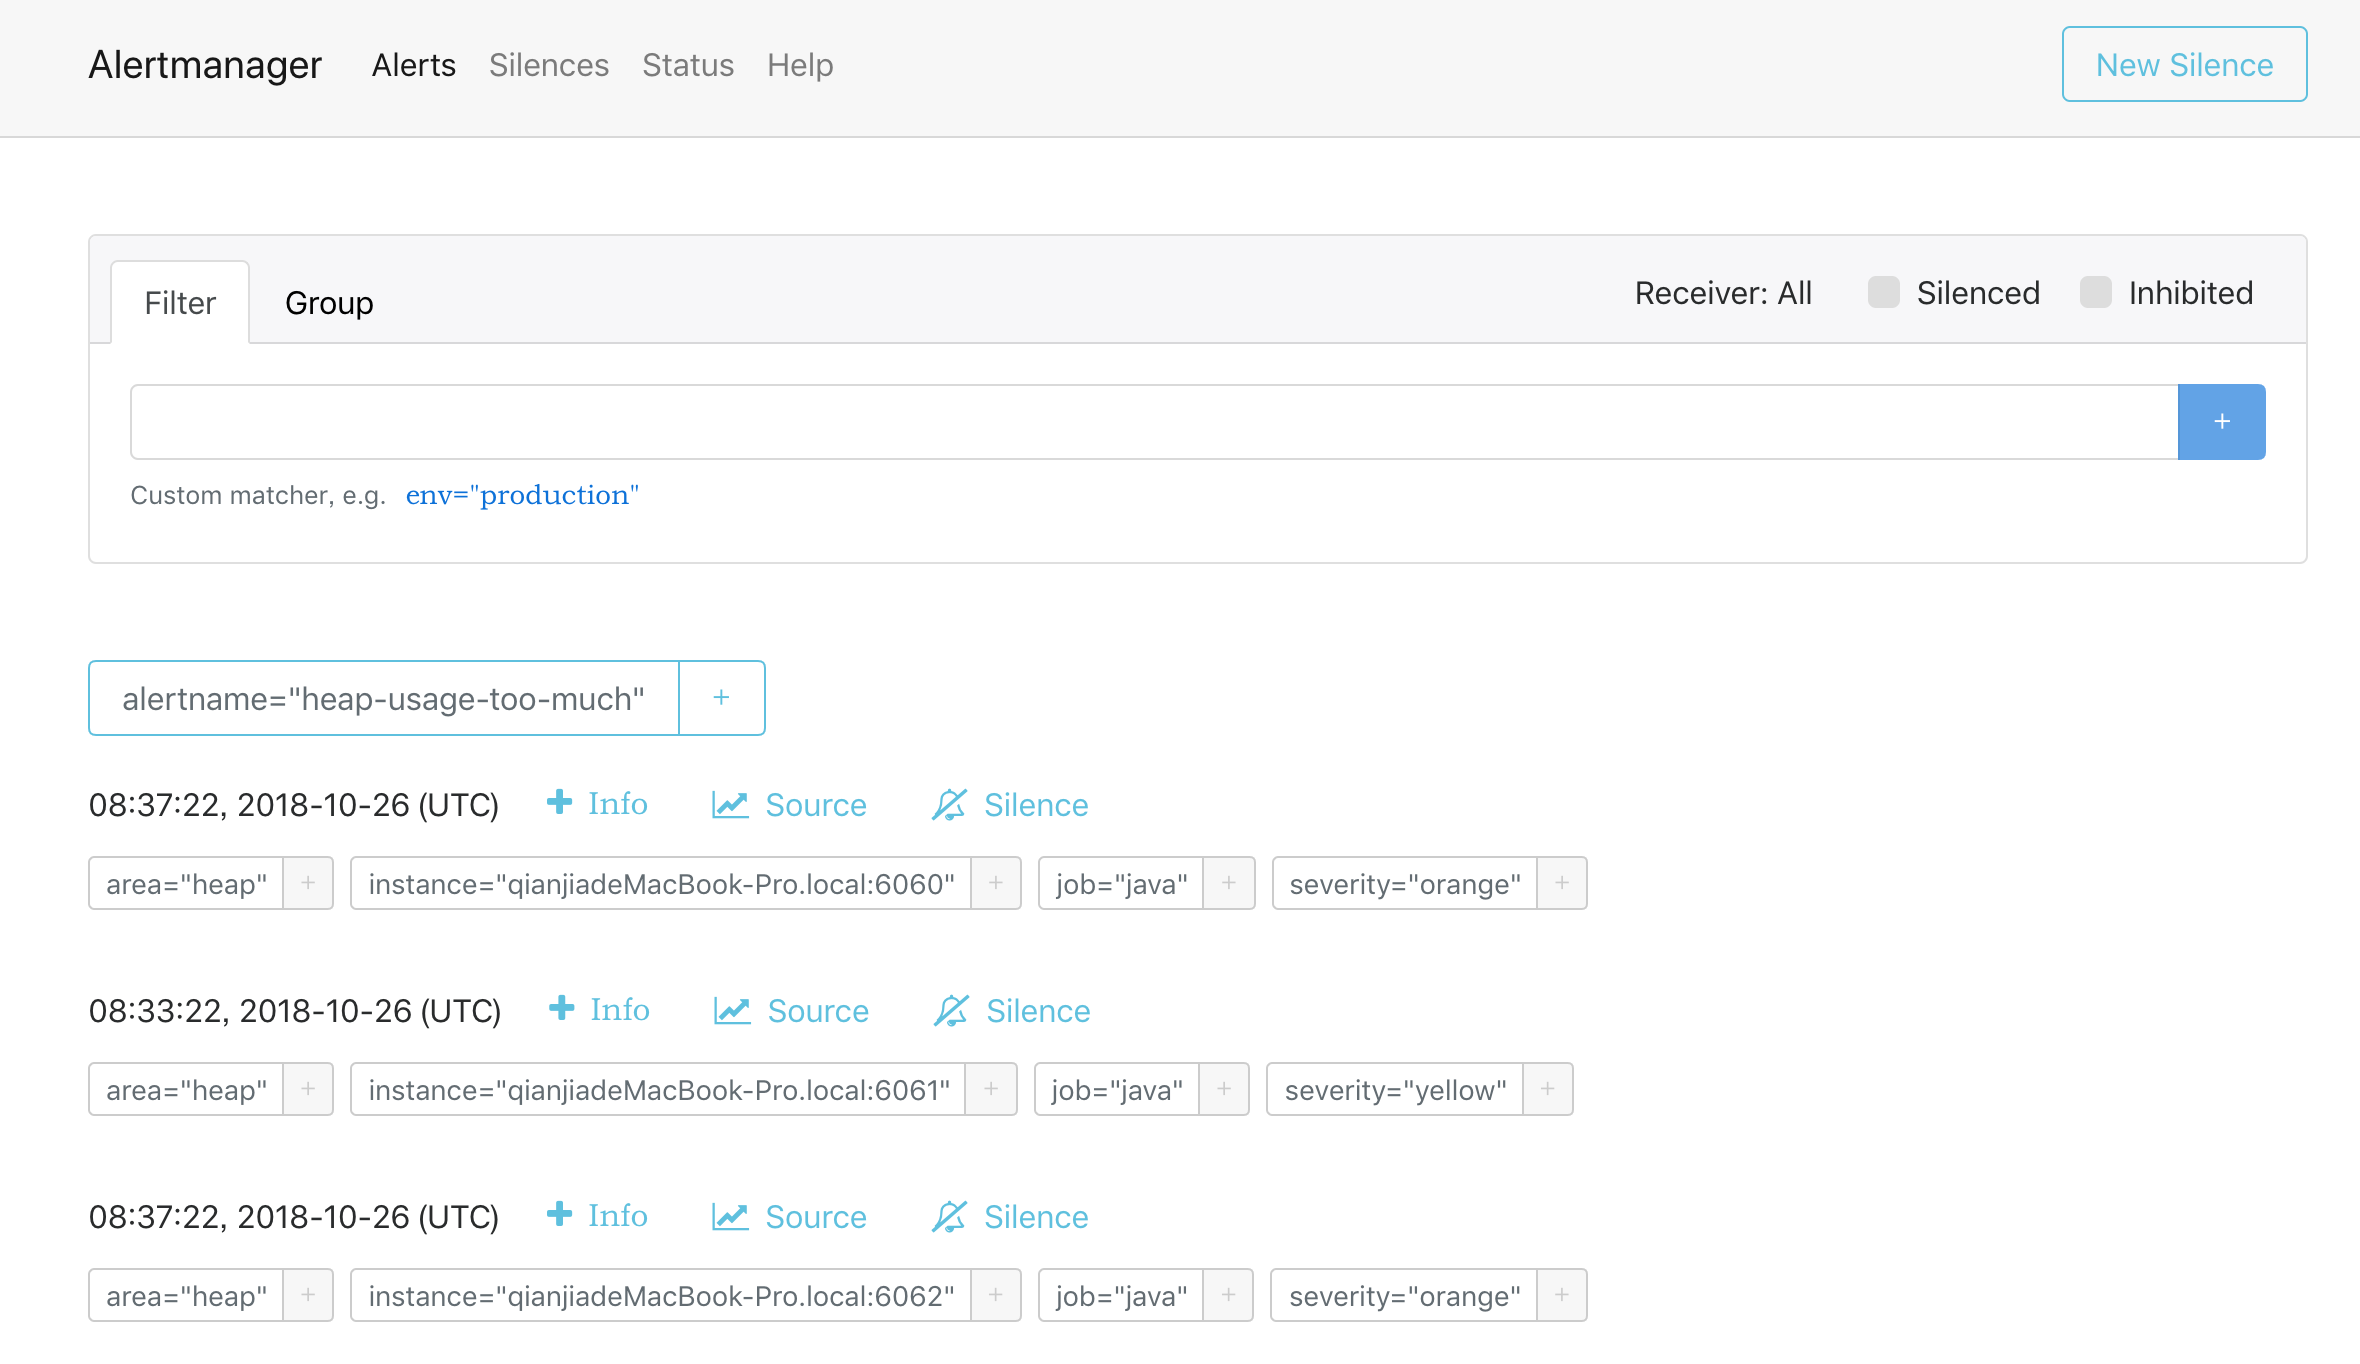
- 访问http://localhost:9093,看看有没有收到Prometheus发送过来的告警(如果没有看到稍等一下):
第五步:等待邮件
等待一会儿(最多5分钟)看看是否收到邮件。如果没有收到,检查配置是否正确,或者docker logs alertmanager看看alertmanager的日志,一般来说都是邮箱配置错误导致。
评论