Rancher中可以很方便的开启监控功能,其使用的是Prometheus Operator + Grafana,那么我们也可以利用它来采集JVM数据。
开启监控
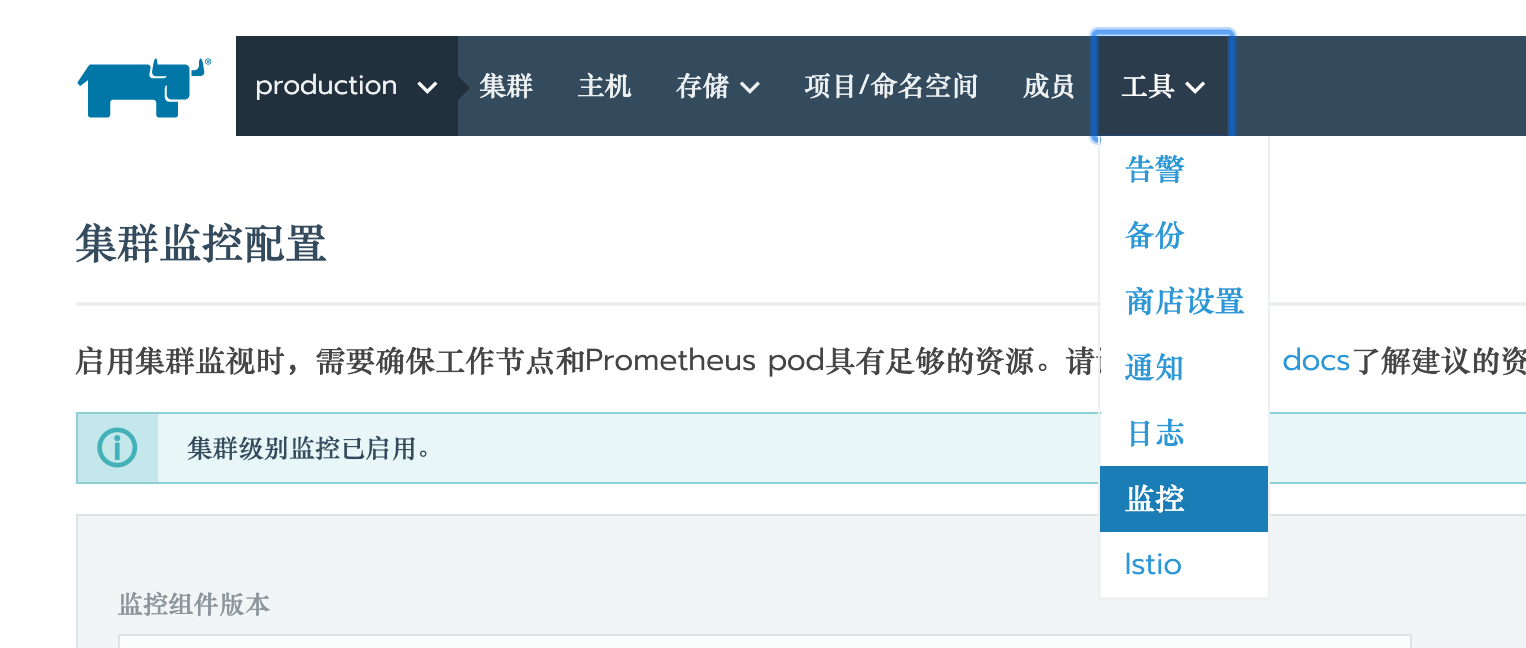
首先,开启集群的监控:
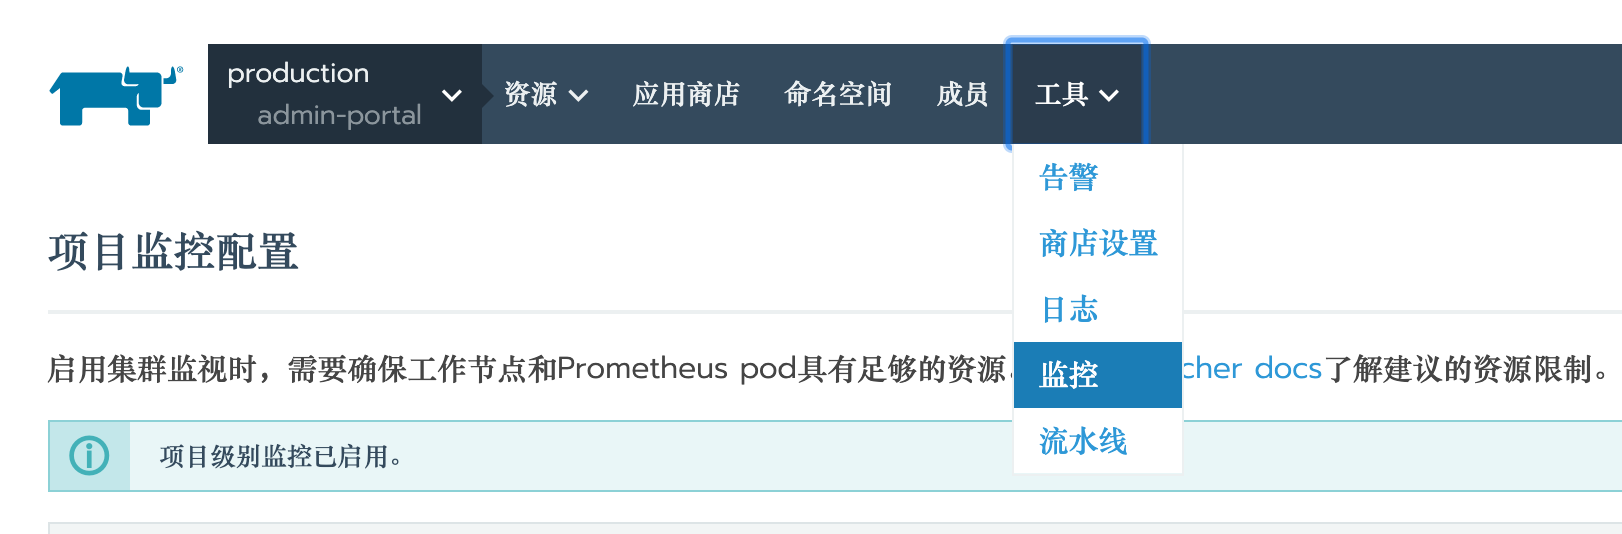
然后,开启项目的监控(可选):
RBAC
给prometheus-operator的service account配置RBAC:
 1
 2
 3
 4
 5
 6
 7
 8
 9
10
11
12
13
14
15
16
17
18
19
20
21
22
23
24
25
26
27
28
29
30
31
|
apiVersion: rbac.authorization.k8s.io/v1beta1
kind: ClusterRole
metadata:
  name: prometheus-all-ns
rules:
- apiGroups: [""]
  resources:
  - nodes
  - services
  - endpoints
  - pods
  verbs: ["get", "list", "watch"]
- apiGroups: [""]
  resources:
  - configmaps
  verbs: ["get"]
- nonResourceURLs: ["/metrics"]
  verbs: ["get"]
---
apiVersion: rbac.authorization.k8s.io/v1beta1
kind: ClusterRoleBinding
metadata:
  name: prometheus-all-ns
roleRef:
  apiGroup: rbac.authorization.k8s.io
  kind: ClusterRole
  name: prometheus-all-ns
subjects:
- kind: ServiceAccount
  name: prometheus-k8s
  namespace: monitoring
|
应用配置JMX Exporter
你的Java应用的镜像得配置JMX Exporter,配置方法见使用Prometheus+Grafana监控JVM,我在这里选择将JMX Exporter端口设置为6060。
然后在你的Deployment/StatefulSets 中配置这个端口:
 1
 2
 3
 4
 5
 6
 7
 8
 9
10
11
12
13
14
15
16
17
18
19
20
21
22
|
apiVersion: apps/v1
kind: Deployment
metadata:
  name: ...
  namespace: ...
spec:
  selector:
    matchLabels:
      app: ...
  replicas: 1
  template:
    metadata:
      labels:
        app: ...
    spec:
      containers:
      - name: ...
        image: ...
        ports:
        - containerPort: 6060
          name: http-metrics
        - ...
|
和 Service 也一样:
 1
 2
 3
 4
 5
 6
 7
 8
 9
10
11
12
13
14
15
16
17
|
apiVersion: v1
kind: Service
metadata:
  namespace: ...
  name: ...
  labels:
    app: ...
    needMonitor: 'true'
spec:
  ports:
  - port: 6060
    targetPort: http-metrics
    protocol: TCP
    name: http-metrics
  - ...
  selector:
    app: ...
|
可以看到,我把端口取了个名字叫做http-metrics,同时Service添加了Label needMonitor: 'true'
添加ServiceMonitor
利用项目Prometheus采集
如果你前面开启了项目监控,并且想用项目Prometheus来收集数据,那么这么做:
ServiceMonitor是Prometheus Operator定义的CRD:
 1
 2
 3
 4
 5
 6
 7
 8
 9
10
11
12
|
apiVersion: monitoring.coreos.com/v1
kind: ServiceMonitor
metadata:
  name: ...
  namespace: ...
spec:
  selector:
    matchLabels:
      needMonitor: 'true'
  endpoints:
  - port: http-metrics
    path: /metrics
|
这样Prometheus就能把同namespace下的所有needMonitor: 'true'的Service的JMX Exporter都采集到。
利用集群Prometheus采集
如果你想直接利用集群的Prometheus,那么你得把ServiceMonitor建在cattle-prometheus下,并且设置namespaceSelector属性:
 1
 2
 3
 4
 5
 6
 7
 8
 9
10
11
12
13
14
15
16
|
apiVersion: monitoring.coreos.com/v1
kind: ServiceMonitor
metadata:
  name: ...
  namespace: cattle-prometheus
spec:
  selector:
    matchLabels:
      needMonitor: 'true'
  endpoints:
  - port: http-metrics
    path: /metrics
  namespaceSelector:
    matchNames:
    - namespace-1
    - namespace-2
|
给Grafana添加JVM Dashboard
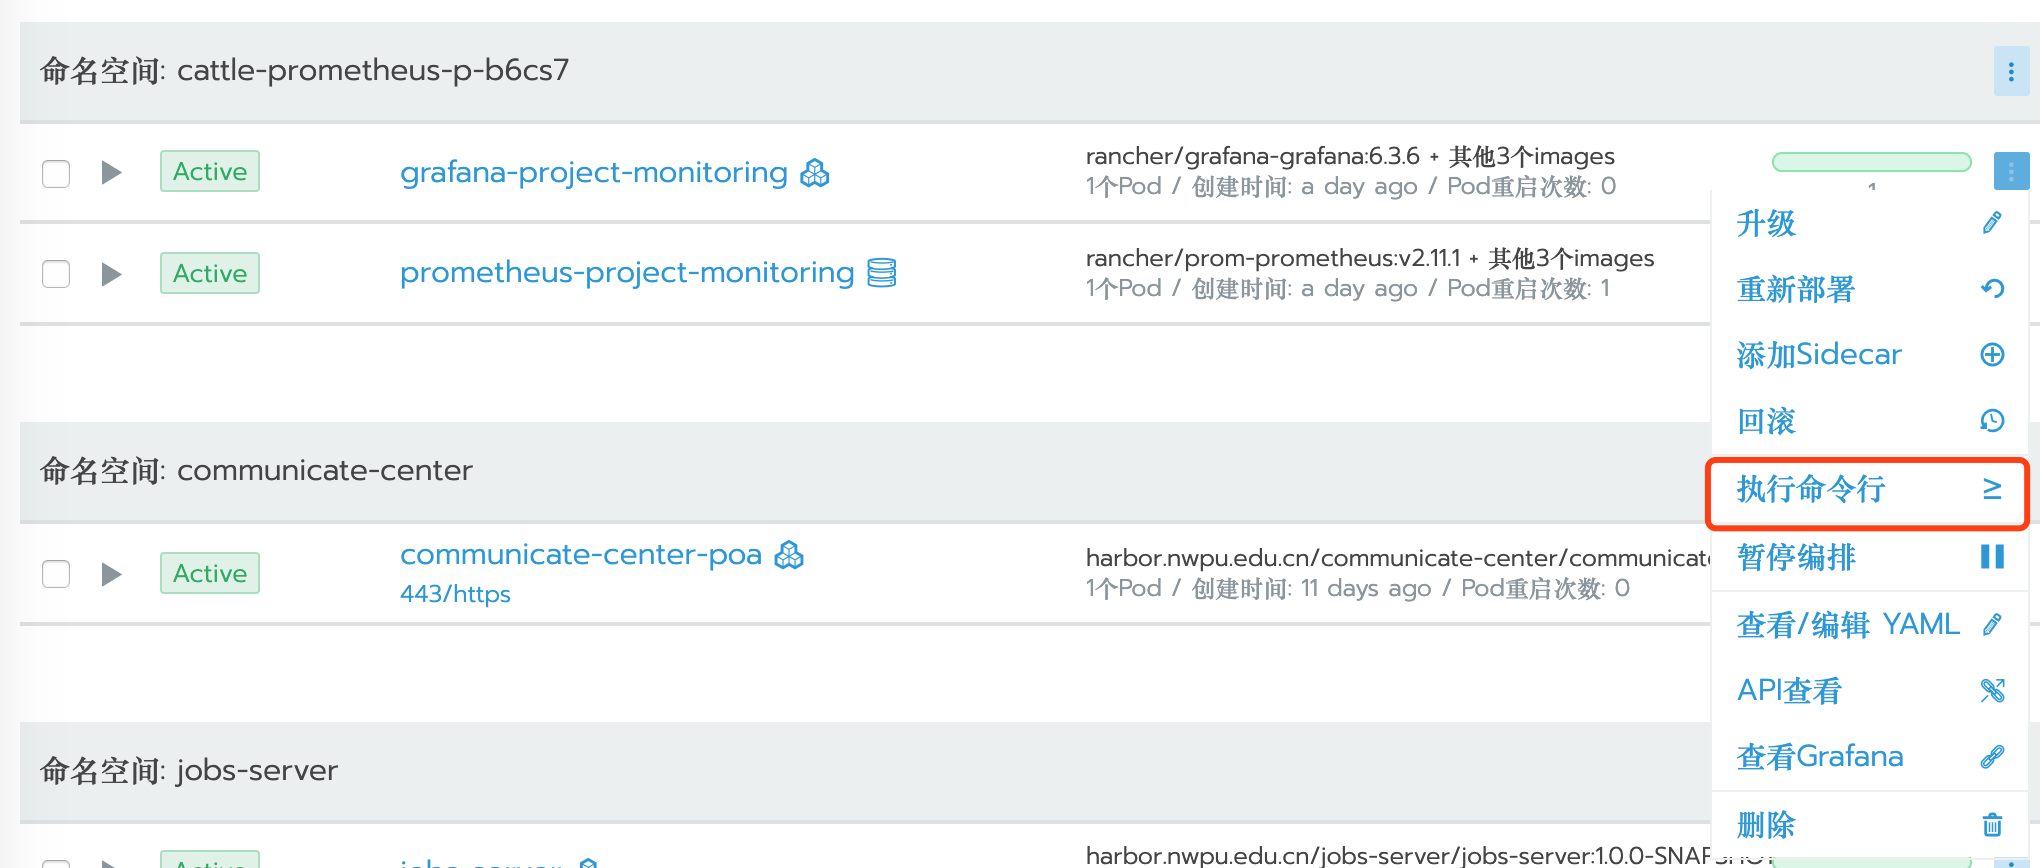
你需要给Grafana添加JVM Dashboard,在这之前你需要设置Grafana的admin密码,进入项目找到Grafana,进入其Shell:
执行:
1
|
grafana-cli admin reset-admin-password <新密码>
|
然后随便进入一个Deployment/StatefulSets,进入Grafana:

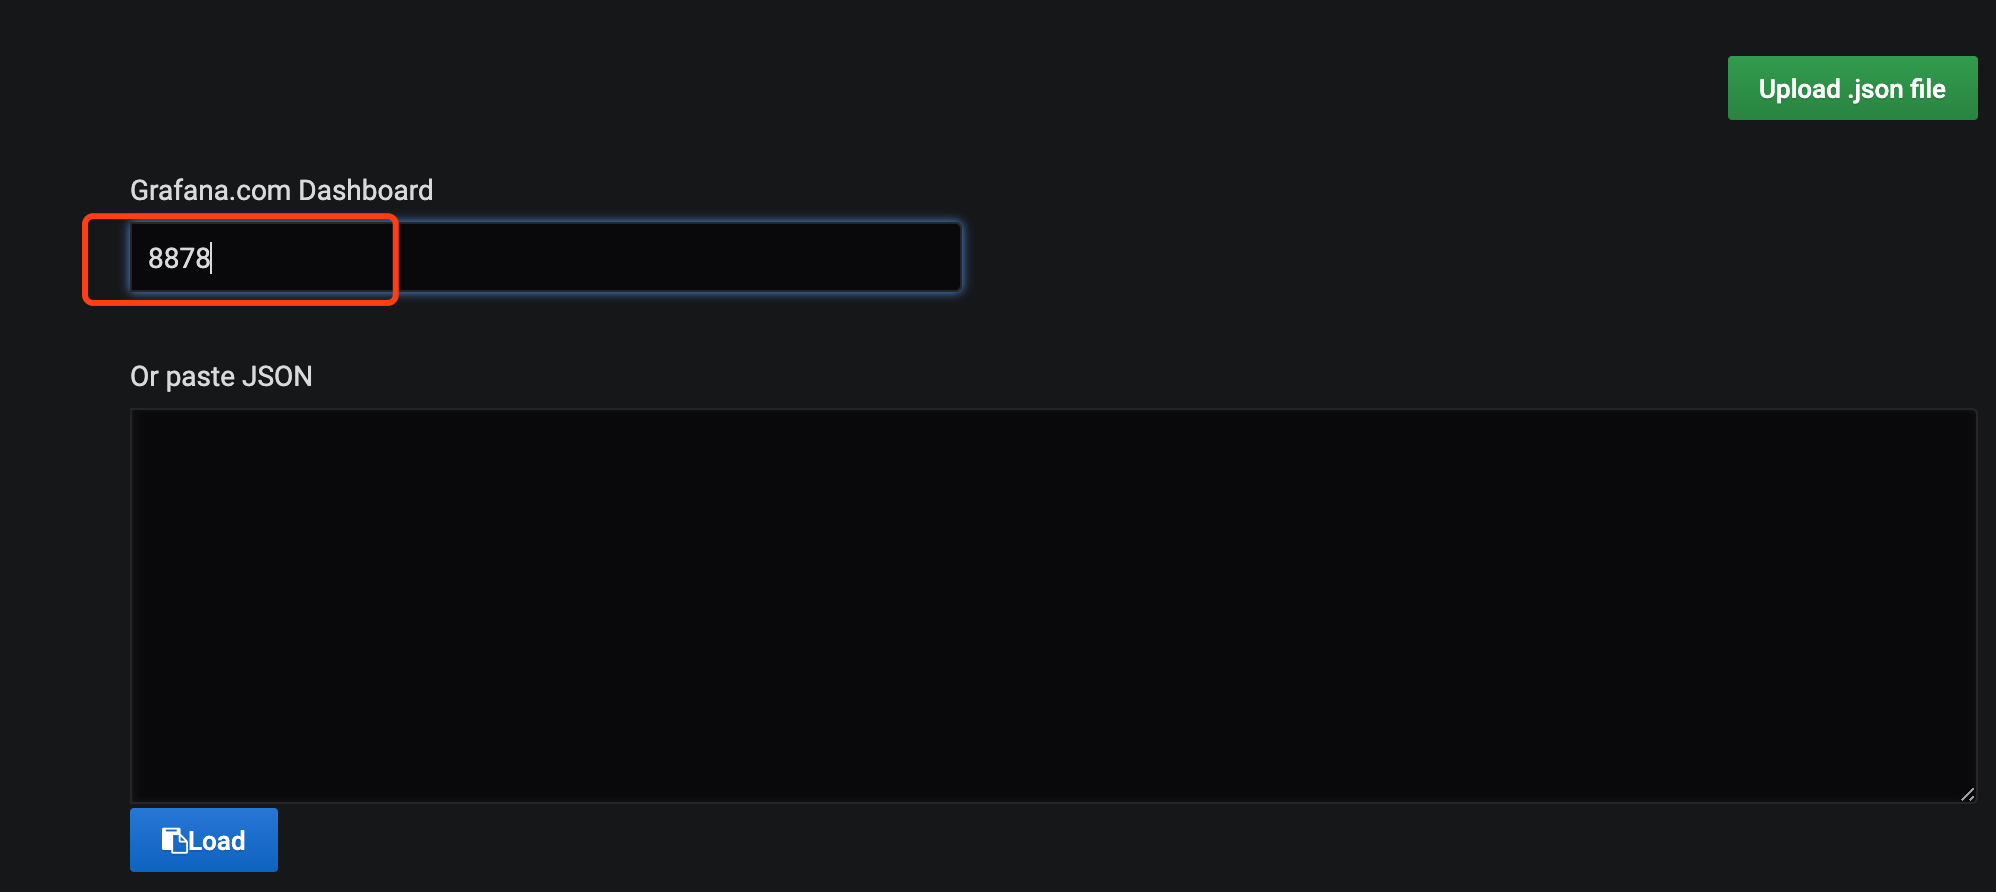
用admin账号和你刚才设置的密码登录进去,进入管理页面导入Dashboard:
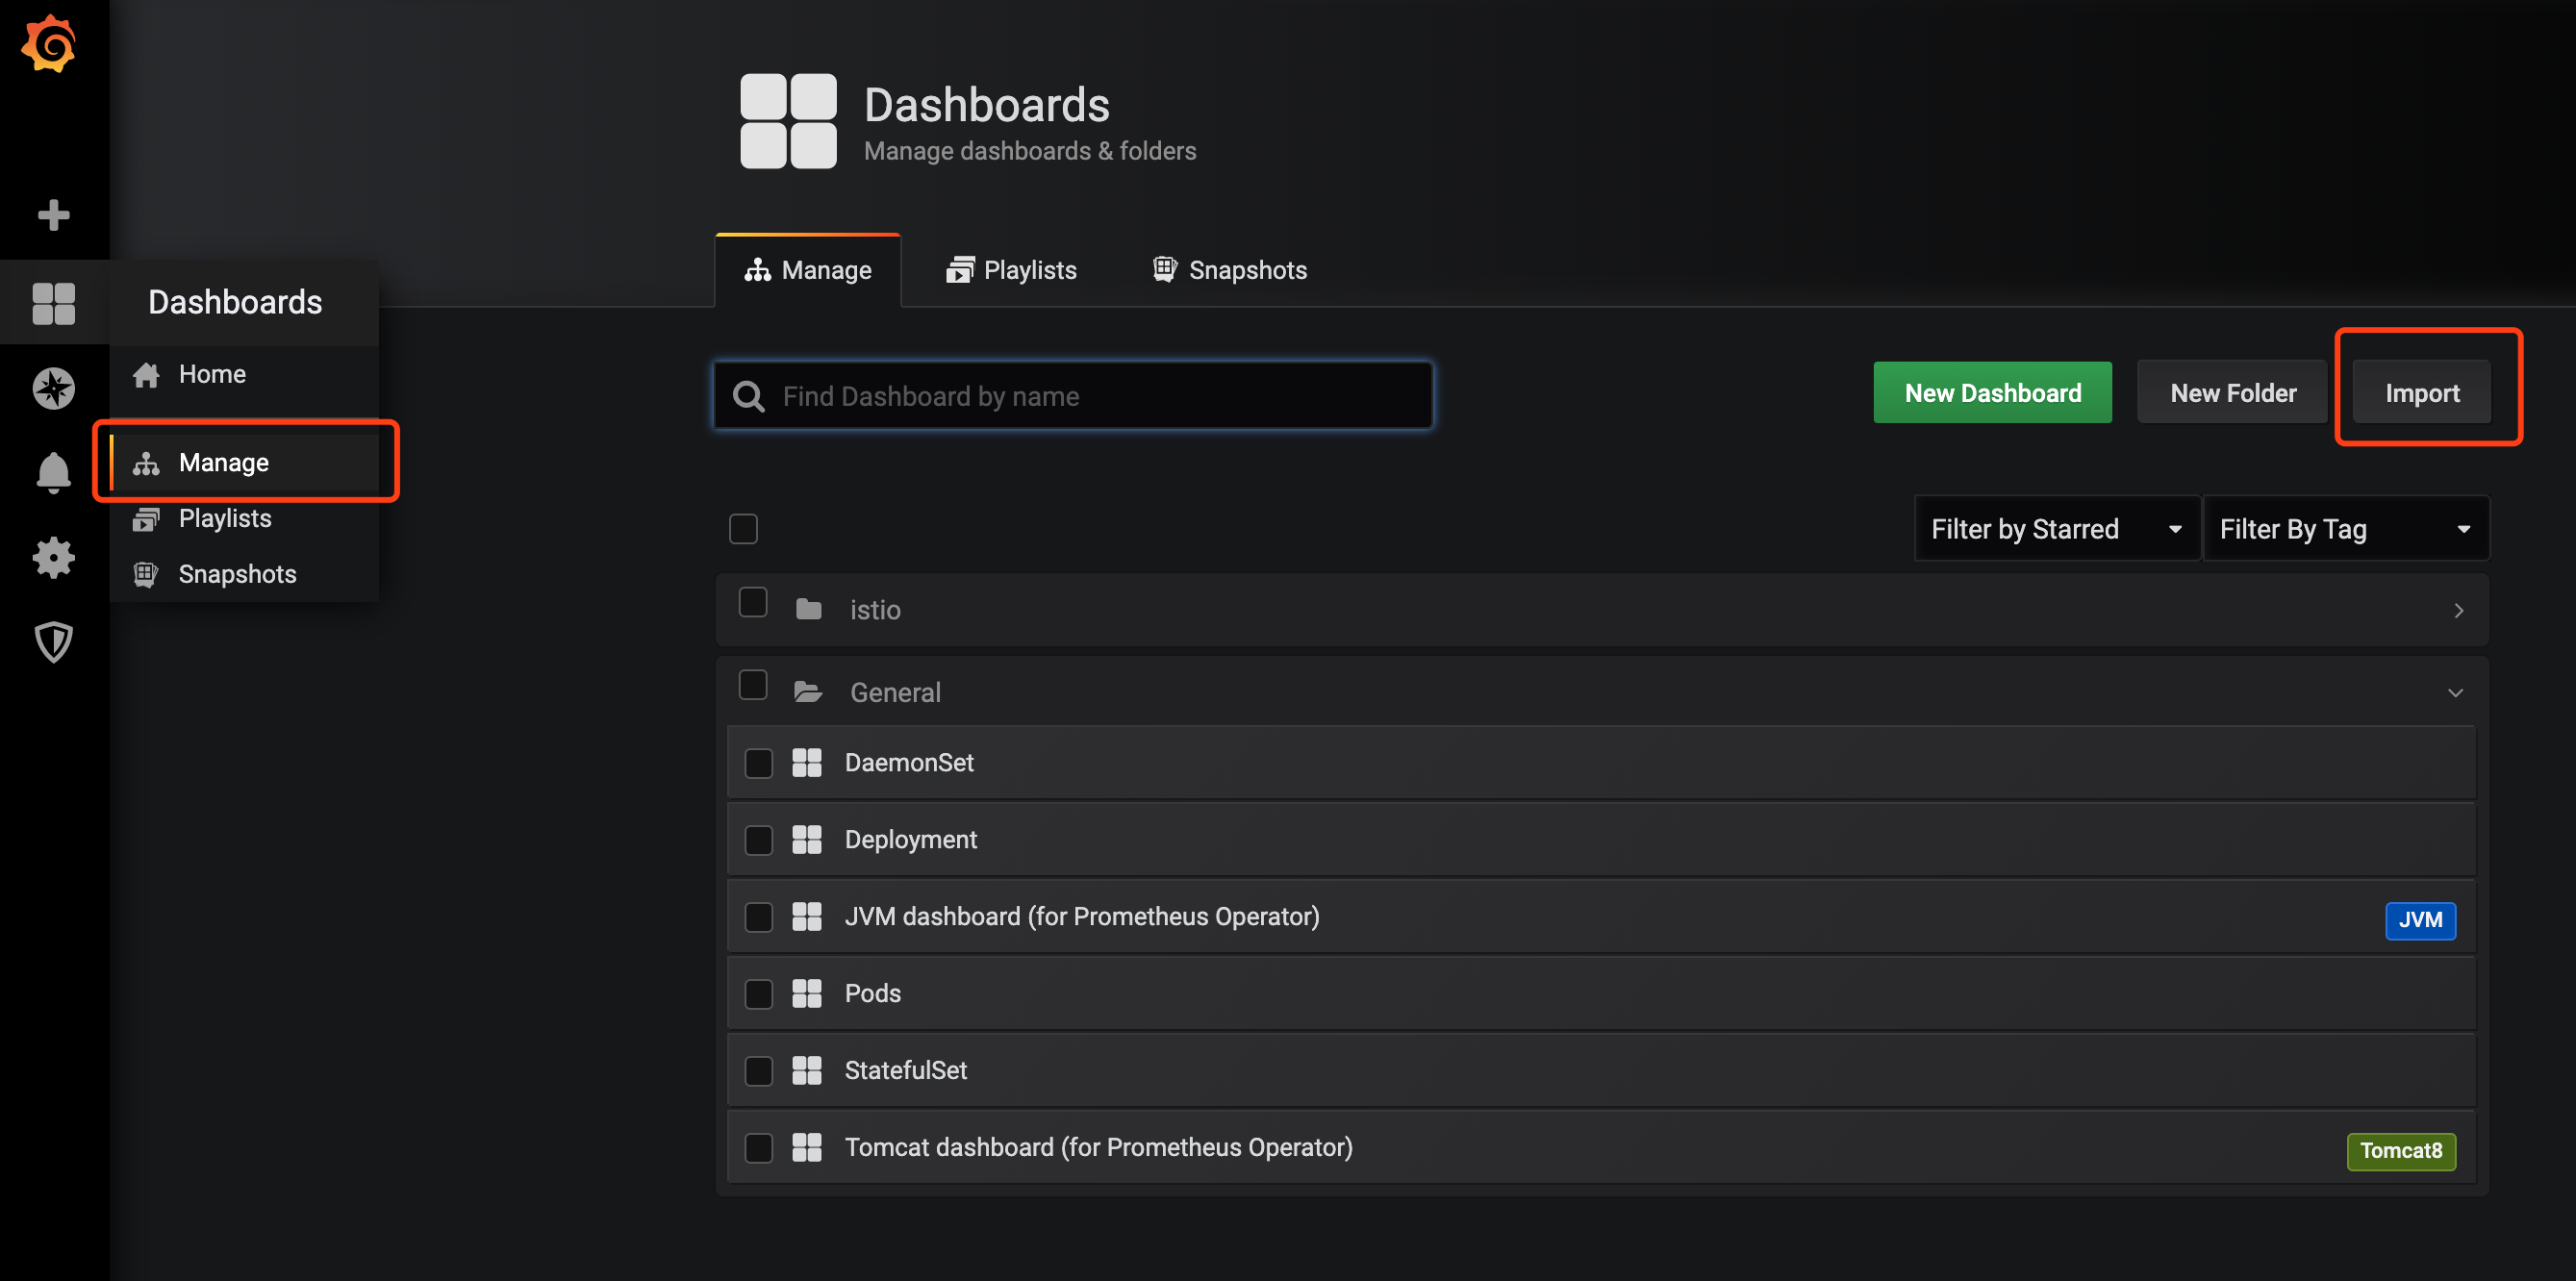
到 https://grafana.com/orgs/chanjarster/dashboards 找到 JVM dashboard (for Prometheus Operator),看到它的编号是8878。把这个编号填到导入页面:
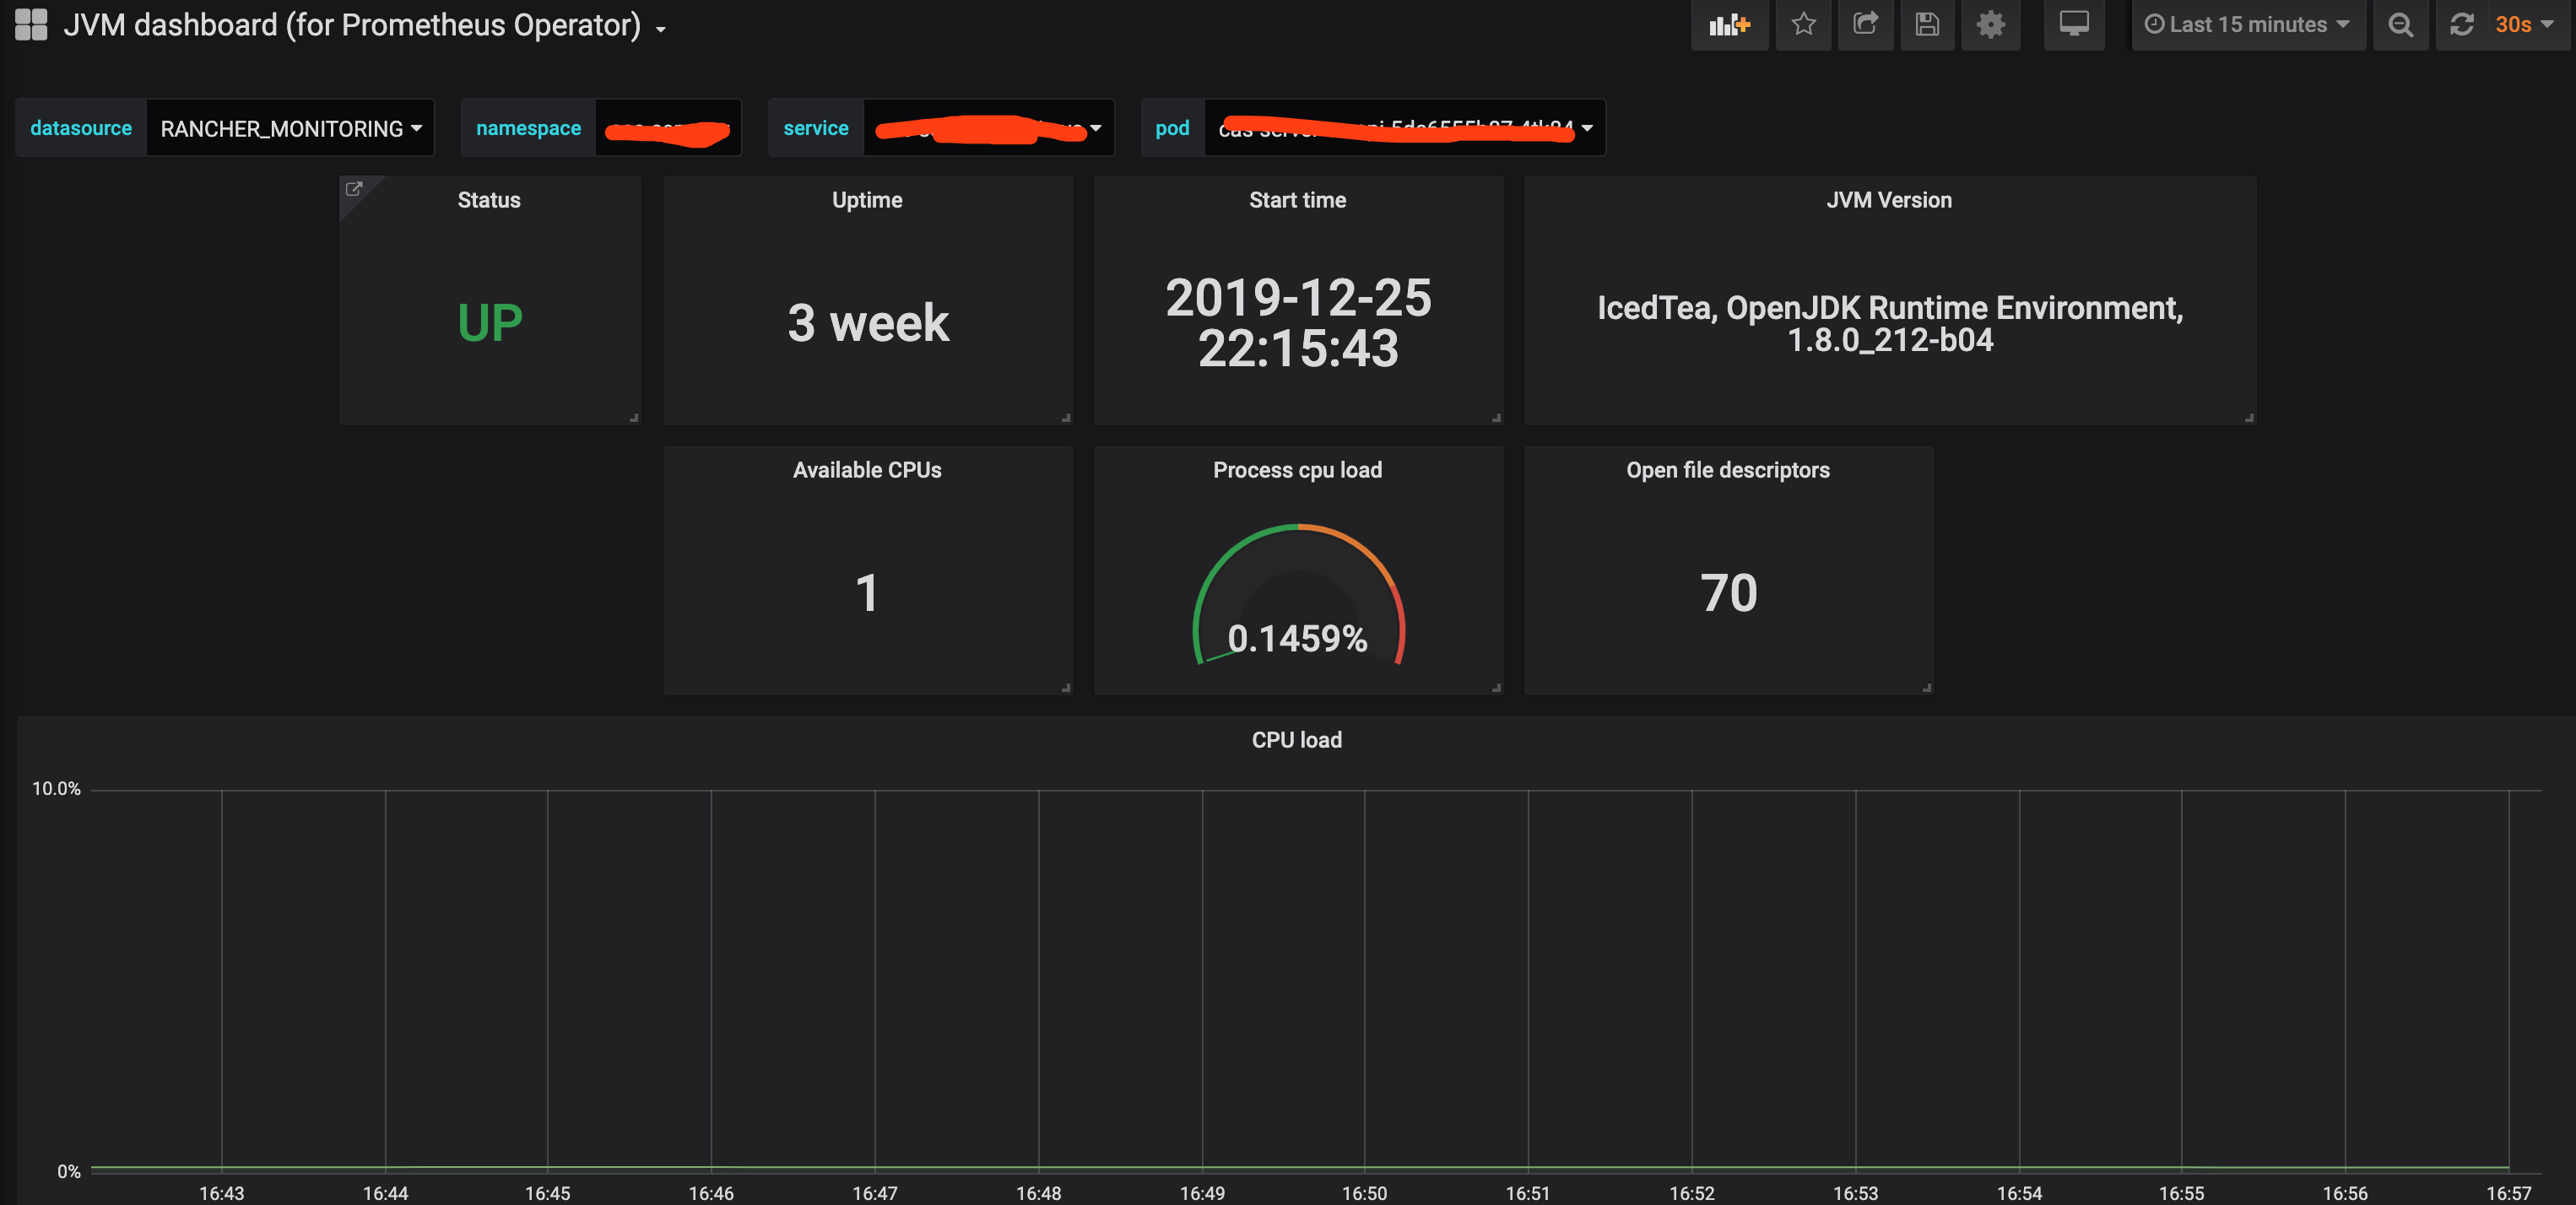
然后大功告成:
评论