Profiling Go Programs里详细举例说明了如何看pprof报告,但并没有清晰简明的告知读者提供数字的是什么意思,所以本文做一个归纳笔记。
解读CPU
以文中提供的CPU Profile来举例说明,我们使用go tool pprof -http=0.0.0.0:4231 havlak1 havalk1.prof来观察
解读Top
 1
 2
 3
 4
 5
 6
 7
 8
 9
10
11
12
13
|
(pprof) top10
Total: 2525 samples
    Flat  Flat%   Sum%      Cum   Cum% Name
     298  11.8%  11.8%      345  13.7% runtime.mapaccess1_fast64
     268  10.6%  22.4%     2124  84.1% main.FindLoops
     251   9.9%  32.4%      451  17.9% scanblock
     178   7.0%  39.4%      351  13.9% hash_insert
     131   5.2%  44.6%      158   6.3% sweepspan
     119   4.7%  49.3%      350  13.9% main.DFS
      96   3.8%  53.1%       98   3.9% flushptrbuf
      95   3.8%  56.9%       95   3.8% runtime.aeshash64
      95   3.8%  60.6%      101   4.0% runtime.settype_flush
      88   3.5%  64.1%      988  39.1% runtime.mallocgc
|
先了解是如何采样的:
- 采样频率是每秒100次
- 一个样本包含goroutine栈的程序计数器(program counters)
- 每次只会采样调用栈的前100行
原文中没有给出列名,这里给了出来,下面是解释:
- Total:总共采样次数,这里是2525次。
- Flat:函数在样本中处于运行状态的次数。简单来说就是函数出现在栈顶的次数,而函数在栈顶则意味着它在使用CPU。
- Flat%:Flat / Total。
- Sum%:自己以及所有前面的Flat%的累积值。解读方式:表中第3行Sum% 32.4%,意思是前3个函数(运行状态)的计数占了总样本数的32.4%
- Cum:函数在样本中出现的次数。只要这个函数出现在栈中那么就算进去,这个和Flat不同(必须是栈顶才能算进去)。也可以解读为这个函数的调用次数。
- Cum%:Cum / Total
解读图
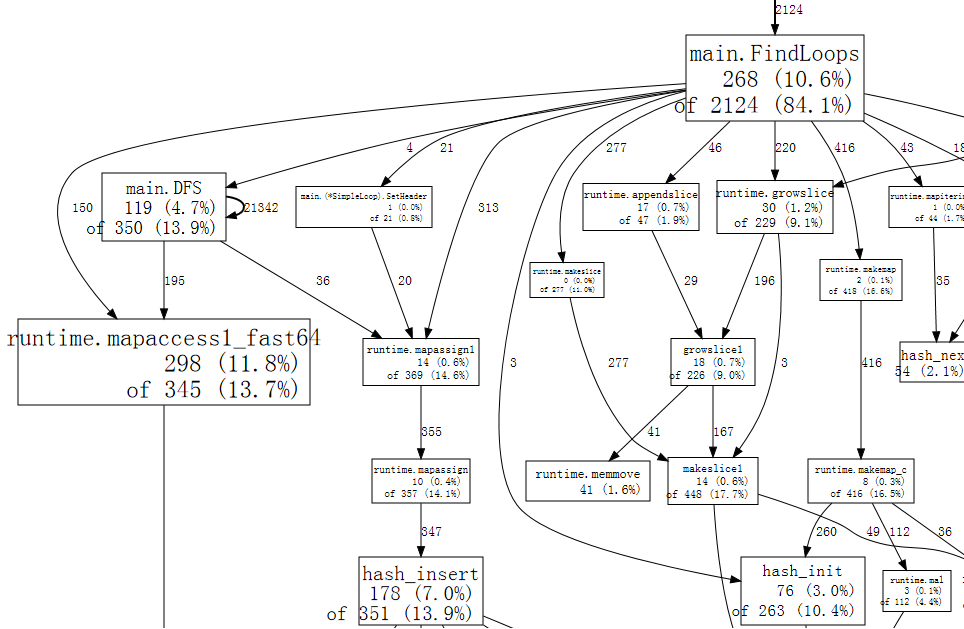
- 方框:函数
- 方框尺寸:代表了Flat的次数
- 箭头:X调用Y
- 线条:记录了X调用Y的次数。数字越大,线条越粗。图中main.DFS有一个指向自己的箭头,说明存在递归调用,而且调用了21342次。
- 方框第一行数字:Flat (Flat%),栈顶次数
- 方框第二行数字:Cum (Cum%),调用次数
解读源码
下面是在pprof交互cli界面看到的报告:
 1
 2
 3
 4
 5
 6
 7
 8
 9
10
11
12
13
14
15
16
17
|
(pprof) list DFS
Total: 2525 samples
ROUTINE ====================== main.DFS in /home/rsc/g/benchgraffiti/havlak/havlak1.go
   119    697 Total samples (flat / cumulative)
     3      3  240: func DFS(currentNode *BasicBlock, nodes []*UnionFindNode, number map[*BasicBlock]int, last []int, current int) int {
     1      1  241:     nodes[current].Init(currentNode, current)
     1     37  242:     number[currentNode] = current
     .      .  243:
     1      1  244:     lastid := current
    89     89  245:     for _, target := range currentNode.OutEdges {
     9    152  246:             if number[target] == unvisited {
     7    354  247:                     lastid = DFS(target, nodes, number, last, lastid+1)
     .      .  248:             }
     .      .  249:     }
     7     59  250:     last[number[currentNode]] = lastid
     1      1  251:     return lastid
(pprof)
|
下面是在Web界面看到的报告(基本差不多,见这里):
 1
 2
 3
 4
 5
 6
 7
 8
 9
10
11
12
13
14
15
16
17
18
19
20
21
22
23
24
25
26
27
28
|
havlak1
Total: 5758 samples
main.DFS
/home/rsc/g/benchgraffiti/havlak/havlak1.go

Total:   225   2296 (flat / cumulative samples)
  235               	return false
  236               }
  237
  238               // DFS - Depth-First-Search and node numbering.
  239               //
  240      3      3 func DFS(currentNode *BasicBlock, nodes []*UnionFindNode, number map[*BasicBlock]int, last []int, current int) int {
  241     18     19 	nodes[current].Init(currentNode, current)
  242           166 	number[currentNode] = current
  243
  244      2      2 	lastid := current
  245    167    167 	for _, target := range currentNode.OutEdges {
  246     17    508 		if number[target] == unvisited {
  247     10   1157 			lastid = DFS(target, nodes, number, last, lastid+1)
  248               		}
  249               	}
  250      7    273 	last[number[currentNode]] = lastid
  251      1      1 	return lastid
  252               }
  253
  254               // FindLoops
  255               //
  256               // Find loops and build loop forest using Havlak's algorithm, which
|
解读内存
以文中提供的内存Profile来举例说明,我们使用go tool pprof -http=0.0.0.0:4231 havlak3 havalk3.mprof来观察。
pprof提供了4种视角,默认是-inuse_space:
-inuse_space :live object占用内存-inuse_objects :live object的数量-alloc_space :程序启动到现在,总共分配的内存-alloc_objects :程序启动到现在总共object的数量
解读Top
1
2
3
4
5
6
7
8
9
|
(pprof) top5
Total: 82.4 MB
    Flat  Flat%   Sum%      Cum   Cum% Name
    56.3  68.4%  68.4%     56.3  68.4% main.FindLoops
    17.6  21.3%  89.7%     17.6  21.3% main.(*CFG).CreateNode
     8.0   9.7%  99.4%     25.6  31.0% main.NewBasicBlockEdge
     0.5   0.6% 100.0%      0.5   0.6% itab
     0.0   0.0% 100.0%      0.5   0.6% fmt.init
(pprof)
|
采样频率:
- 每分配512K,采样一个block(具体啥意思不知道)
照例我们加上列:
- Total:总共占用内存
- Flat:函数分配的内存,不包含它调用其他函数造成的内存分配。
- Flat%:Flat / Total
- Sum%:自己和前面所有的Flat%累积值
- Cum:这个函数分配的内存,以及它调用其他函数分配的内存之和。可以解读为因为这个函数所造成的所有内存分配。
- Cum%:Cum / Total
解读源码
和CPU源码解读差不多:
 1
 2
 3
 4
 5
 6
 7
 8
 9
10
11
12
13
14
15
16
17
18
19
20
21
22
23
|
(pprof) list FindLoops
Total: 82.4 MB
ROUTINE ====================== main.FindLoops in /home/rsc/g/benchgraffiti/havlak/havlak3.go
  56.3   56.3 Total MB (flat / cumulative)
...
   1.9    1.9  268:     nonBackPreds := make([]map[int]bool, size)
   5.8    5.8  269:     backPreds := make([][]int, size)
     .      .  270:
   1.9    1.9  271:     number := make([]int, size)
   1.9    1.9  272:     header := make([]int, size, size)
   1.9    1.9  273:     types := make([]int, size, size)
   1.9    1.9  274:     last := make([]int, size, size)
   1.9    1.9  275:     nodes := make([]*UnionFindNode, size, size)
     .      .  276:
     .      .  277:     for i := 0; i < size; i++ {
   9.5    9.5  278:             nodes[i] = new(UnionFindNode)
     .      .  279:     }
...
     .      .  286:     for i, bb := range cfgraph.Blocks {
     .      .  287:             number[bb.Name] = unvisited
  29.5   29.5  288:             nonBackPreds[i] = make(map[int]bool)
     .      .  289:     }
...
|
可以发现L288占用了29.5M内存。用-inuse_objects来观察,可以看到分配次数:
 1
 2
 3
 4
 5
 6
 7
 8
 9
10
11
12
13
14
15
16
17
18
19
20
21
22
23
|
$ go tool pprof --inuse_objects havlak3 havlak3.mprof
Adjusting heap profiles for 1-in-524288 sampling rate
Welcome to pprof!  For help, type 'help'.
(pprof) list FindLoops
Total: 1763108 objects
ROUTINE ====================== main.FindLoops in /home/rsc/g/benchgraffiti/havlak/havlak3.go
720903 720903 Total objects (flat / cumulative)
...
     .      .  277:     for i := 0; i < size; i++ {
311296 311296  278:             nodes[i] = new(UnionFindNode)
     .      .  279:     }
     .      .  280:
     .      .  281:     // Step a:
     .      .  282:     //   - initialize all nodes as unvisited.
     .      .  283:     //   - depth-first traversal and numbering.
     .      .  284:     //   - unreached BB's are marked as dead.
     .      .  285:     //
     .      .  286:     for i, bb := range cfgraph.Blocks {
     .      .  287:             number[bb.Name] = unvisited
409600 409600  288:             nonBackPreds[i] = make(map[int]bool)
     .      .  289:     }
...
(pprof)
|
分析GC
你可以通过CPU Profile来分析GC:
 1
 2
 3
 4
 5
 6
 7
 8
 9
10
11
12
13
|
(pprof) top10
Total: 1173 samples
     205  17.5%  17.5%     1083  92.3% main.FindLoops
     138  11.8%  29.2%      215  18.3% scanblock
      88   7.5%  36.7%       96   8.2% sweepspan
      76   6.5%  43.2%      597  50.9% runtime.mallocgc
      75   6.4%  49.6%       78   6.6% runtime.settype_flush
      74   6.3%  55.9%       75   6.4% flushptrbuf
      64   5.5%  61.4%       64   5.5% runtime.memmove
      63   5.4%  66.8%      524  44.7% runtime.growslice
      51   4.3%  71.1%       51   4.3% main.DFS
      50   4.3%  75.4%      146  12.4% runtime.MCache_Alloc
(pprof)
|
可以看到runtime.mallocgc的调用次数占了50.9%。
查看系统为何进行垃圾收集的另一种方法是查看导致收集的分配,这些分配在mallocgc中花费了大部分时间。使用--nodefraction=0.1去掉占比小于10%的结果:
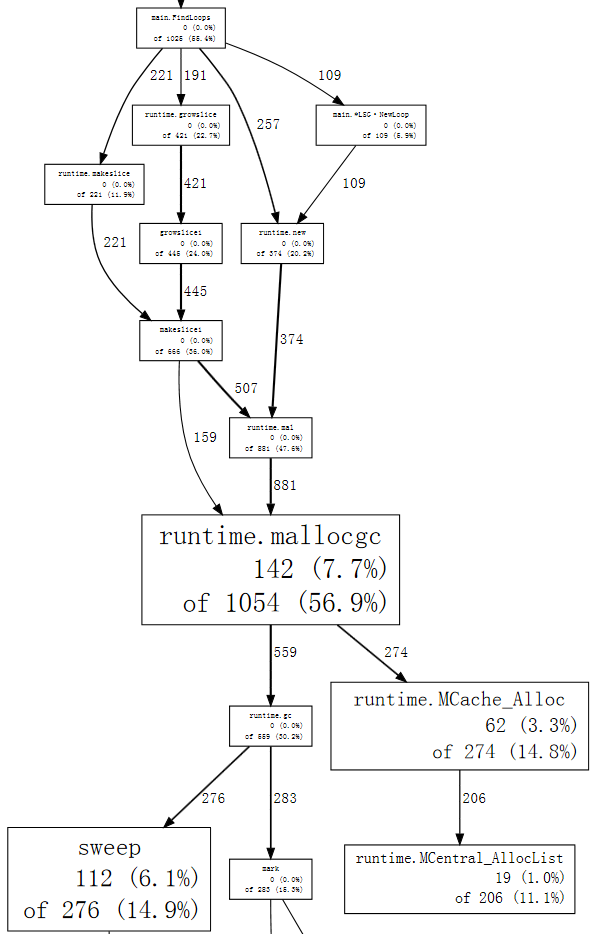
可以看到main.FindLoops导致了大多数GC。
在线Profile
如果你是一个Web应用,你可以使用net/http/pprof来添加一个Handler,访问http://<host>:<port>/debug/pprof/可以得到功能列表:
 1
 2
 3
 4
 5
 6
 7
 8
 9
10
11
12
13
14
|
/debug/pprof/

Types of profiles available:
Count	Profile
8   allocs
0	  block
0	  cmdline
10	goroutine
8	  heap
0	  mutex
0	  profile
19	threadcreate
0	  trace
...
|
然后你可以通过这样来用go tool pprof <url>来分析,比如:
1
2
3
4
|
# 分析CPU
go tool pprof http://localhost:9090/debug/pprof/profile
# 打开网页分析heap
go tool pprof -http=0.0.0.0:4231 http://localhost:9090/debug/pprof/heap
|
在生产中,你需要对/debug/pprof/*做HTTP BasicAuth保护(很简单,一个响应头和请求头罢了),那么你去抓取数据分析的时候得这样:
1
|
go tool pprof http://<user>:<password>@localhost:9090/debug/pprof/profile
|
参考资料
评论